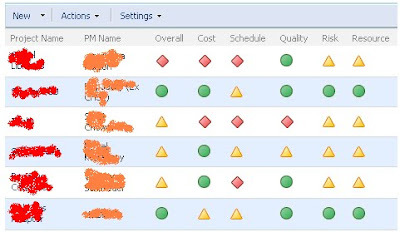
We can generate the KPI list using simple SharePoint list with computed columns! Here is how we can get SharePoint list based status indicator
Create a SharePoint list with desired fields, then create a field with choices, Lets say, Field name Cost_Input: with values Red, Green, Blue. Then lets create another computed field called Cost of type: Number, which is based on the existing field COST_Input field.
Enter the formula for the calculated field as:
-----------------------------
=IF(Cost_input="Green","<DIV style='text-align: center'><IMG src='/_layouts/images/KPIDefault-0.gif'
/></DIV>",IF(Cost_input="Yellow","<DIV style='text-align: center'><IMG src='/_layouts/images/KPIDefault-1.gif'
/></DIV>",IF(Cost_input="Red","<DIV style='text-align: center'><IMG src='/_layouts/images/KPIDefault-2.gif'
/></DIV>")))
---------------------------------------
Then after add content editor webpart exactly after the list webpart, then add the below code snippet in the source editor of content editor webpart
--------------------------
<script type="text/javascript">
//
// Text to HTML
//
var theTDs = document.getElementsByTagName("TD");
var i=0;
var TDContent = " ";
while (i < theTDs.length) {
try {
TDContent = theTDs[i].innerText || theTDs[i].textContent;
if ((TDContent.indexOf("<DIV") == 0) && (TDContent.indexOf("</DIV>") >= 0)) {
theTDs[i].innerHTML = TDContent;
}
}
catch(err){}
i=i+1;
}
//
// ExpGroupRenderData overwrites the default SharePoint function
// This part is needed for collapsed groupings
//
function ExpGroupRenderData(htmlToRender, groupName, isLoaded) {
var tbody=document.getElementById("tbod"+groupName+"_");
var wrapDiv=document.createElement("DIV");
wrapDiv.innerHTML="<TABLE><TBODY id=\"tbod"+ groupName+"_\" isLoaded=\""+isLoaded+ "\">"+htmlToRender+"</TBODY></TABLE>";
var theTBODYTDs = wrapDiv.getElementsByTagName("TD"); var j=0; var TDContent = " ";
while (j < theTBODYTDs.length) {
try {
TDContent = theTBODYTDs[j].innerText || theTBODYTDs[j].textContent;
if ((TDContent.indexOf("<DIV") == 0) && (TDContent.indexOf("</DIV>") >= 0)) {
theTBODYTDs[j].innerHTML = TDContent;
}
}
catch(err){}
j=j+1;
}
tbody.parentNode.replaceChild(wrapDiv.firstChild.firstChild,tbody);
}
</script>
-----------------------------
----------------------------------------Create a SharePoint list with desired fields, then create a field with choices, Lets say, Field name Cost_Input: with values Red, Green, Blue. Then lets create another computed field called Cost of type: Number, which is based on the existing field COST_Input field.
Enter the formula for the calculated field as:
-----------------------------
=IF(Cost_input="Green","<DIV style='text-align: center'><IMG src='/_layouts/images/KPIDefault-0.gif'
/></DIV>",IF(Cost_input="Yellow","<DIV style='text-align: center'><IMG src='/_layouts/images/KPIDefault-1.gif'
/></DIV>",IF(Cost_input="Red","<DIV style='text-align: center'><IMG src='/_layouts/images/KPIDefault-2.gif'
/></DIV>")))
---------------------------------------
Then after add content editor webpart exactly after the list webpart, then add the below code snippet in the source editor of content editor webpart
--------------------------
<script type="text/javascript">
//
// Text to HTML
//
var theTDs = document.getElementsByTagName("TD");
var i=0;
var TDContent = " ";
while (i < theTDs.length) {
try {
TDContent = theTDs[i].innerText || theTDs[i].textContent;
if ((TDContent.indexOf("<DIV") == 0) && (TDContent.indexOf("</DIV>") >= 0)) {
theTDs[i].innerHTML = TDContent;
}
}
catch(err){}
i=i+1;
}
//
// ExpGroupRenderData overwrites the default SharePoint function
// This part is needed for collapsed groupings
//
function ExpGroupRenderData(htmlToRender, groupName, isLoaded) {
var tbody=document.getElementById("tbod"+groupName+"_");
var wrapDiv=document.createElement("DIV");
wrapDiv.innerHTML="<TABLE><TBODY id=\"tbod"+ groupName+"_\" isLoaded=\""+isLoaded+ "\">"+htmlToRender+"</TBODY></TABLE>";
var theTBODYTDs = wrapDiv.getElementsByTagName("TD"); var j=0; var TDContent = " ";
while (j < theTBODYTDs.length) {
try {
TDContent = theTBODYTDs[j].innerText || theTBODYTDs[j].textContent;
if ((TDContent.indexOf("<DIV") == 0) && (TDContent.indexOf("</DIV>") >= 0)) {
theTBODYTDs[j].innerHTML = TDContent;
}
}
catch(err){}
j=j+1;
}
tbody.parentNode.replaceChild(wrapDiv.firstChild.firstChild,tbody);
}
</script>
-----------------------------
Update: For SharePoint 2013, Use the below code in Script editor:
<script type="text/javascript" src="http://www.google.com/jsapi"></script>
<script type="text/javascript">
//load jQuery
google.load("jquery", "1.2.6");
</script>
<script type="text/javascript">
//make a fn for reuse
$.calcHTML = function() {
//loop through TDs moving text node to html
$("td.ms-vb2,td[id$='Calculated'],td.ms-stylebody,td.ms-formbody").filter(":contains(<DIV)").each(function(){
$(this).html($(this).text());
});
};
//call calcHTML on DOM ready for ungrouped rows
$(function() {
$.calcHTML();
if (showpreview1) { //check for preview script
$("td.ms-vb-title").bind("mouseover", function(){
showpreview1(this);
$.calcHTML();
});
}
});
//replace ExpGroupRenderData, call calcHTML for grouped rows
function ExpGroupRenderData(htmlToRender, groupName, isLoaded) {
$("#tbod"+groupName+"_").attr("isloaded",isLoaded).html(htmlToRender).show("fast",$.calcHTML());
}
</script>
Alternate approach: Using Dataview web part to Design KPI Dashboard
Same thing can be achieved using SharePoint Designer & Dataview webpart. Just convert the existing List view to XSLT Dataview and set the conditional formatting as in below images.Set the conditional formatting style:
Read more: http://www.sharepointdiary.com/2010/07/kpi-dashboard-using-sharepoint-list.html#ixzz3Re81ghrr


No comments:
Post a Comment